
plotd 0.8.0-rc4
Plot streams of data from the command line.
To use this package, run the following command in your project's root directory:
Manual usage
Put the following dependency into your project's dependences section:
Plotcli: Plot streams of data from the command line 
Plotcli is a command line application that can create plots from text/csv files and from piped data, making it useful during data analysis. Plotcli works best in combination with other command line tools such as awk or miller. Plotcli will ignore any lines it does not understand, so it is safe to use with files that contain non csv data as well. Typically I use it during simulations, where I simulate data, which I pipe to a file and then I plot it using plotcli:
plotcli < path/to/file
It will plot the data and save the plot to a file (by default plotcli.png). Plotcli has a command line switch similar to tail (-f) so that it will keep checking for new data until it is killed with ctrl+c.
Plotcli is meant to be adaptive and will automatically adapt the plot boundaries to encompass all the data.
Installation
You need to have dub and cairo installed (https://github.com/D-Programming-Language/dub). Then you can install plotcli as follows:
git clone http://github.com/BlackEdder/plotd.git
cd plotd
dub build -b release
This will create a binary in bin/plotcli which you can copy anywhere in your path.
GTK Windows
It is also possible to compile plotd with gtk support by running
dub build -c plotcli-gtk -b release
Now you can specify --format gtk and plotcli will open a window that will show the resulting plot.
Usage:
Plotcli has a --help switch which explains the options available. You can also see its output here
Types of plots
Some of the most commonly used types of plots supported by plotcli are: point, line, hist, hist3d and box. Because plotcli is build on ggplotd it supports the whole range of types supported by ggplotd. Therefore, for a complete list you can browse its documentation here: http://blackedder.github.io/ggplotd/geom.html. Any function that starts with geom is a type supported by plotcli. To get the type name you remove the geom from the function name and take the lowercase version. E.g. geomBox results in box, geomHist3D in hist3d etc.
Examples
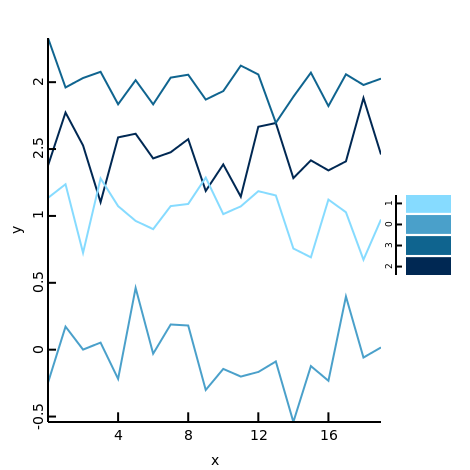
Lines
This example creates lines from each column. With the x coordinate given by the row number. When run with:
plotcli < examples/1/data.txt
it produces the following figure:
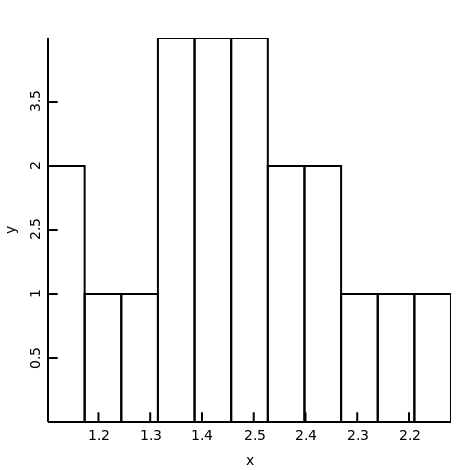
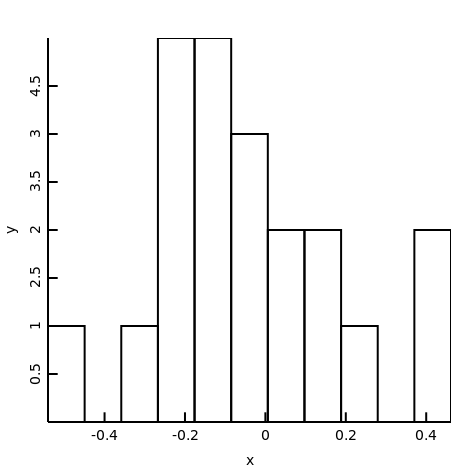
Histogram
The following example creates 4 histograms, one for each column. See below for the histogram of the first column. You can see the other columns by following the links: 2, 3 and 4.
plotcli < examples/2/data.txt
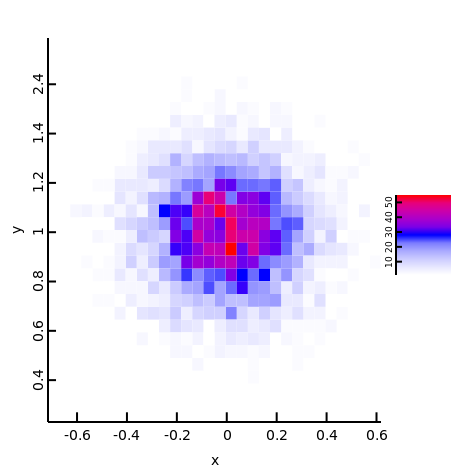
3D Histogram
Here the first two columns are used as the x and y data for a 3D histogram.
plotcli < examples/3/data.txt
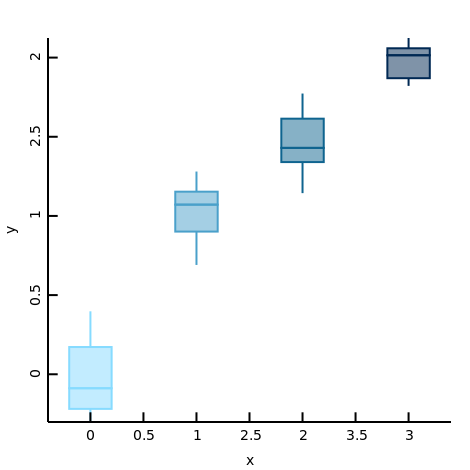
Box plot
Here each column is turned into a box plot.
plotcli -o example4 < examples/4/data.txt
Further examples
The package also contains a program to produce some further examples. This program is compiled with dub -c examples and builds an executable bin/generator that can be run to explore some further options.
Further tips
Of course plotcli can easily be used together with other command line tools. For example I used the following command
awk '{ print $2/$3 }' abc_data/10_samples2 | plotcli -b 0,1,0,50
To plot a histogram of the second column divided by the third column.
License
The library is distributed under the GPL-v3 license. See the file COPYING for more details.
- Registered by Edwin van Leeuwen
- 0.8.0-rc4 released 8 years ago
- BlackEdder/plotd
- GPL-3.0
- Copyright © 2014, Edwin van Leeuwen
- Authors:
- Dependencies:
- docopt, ggplotd, dunit
- Versions:
-
Show all 33 versions1.0.1-beta 2016-Sep-13 1.0.0 2016-Aug-19 1.0.0-beta 2016-Aug-19 0.9.1 2016-Jun-06 0.9.0 2016-May-18 - Download Stats:
-
-
0 downloads today
-
0 downloads this week
-
0 downloads this month
-
761 downloads total
-
- Score:
- 1.6
- Short URL:
- plotd.dub.pm