
ggplotd 0.4.8
Plotting library for the D programming library. The design is inspired by ggplot2 for R.
To use this package, run the following command in your project's root directory:
Manual usage
Put the following dependency into your project's dependences section:
GGPlotD 
GGPlotD is a plotting library for the D programming language. The design is heavily inspired by ggplot2 for R, which is based on a general Grammar of Graphics described by Leland Wilkinson. The library depends on cairo(D) for the actual drawing. The library is designed to make it easy to build complex plots from simple building blocks.
Install
Easiest is to use dub and add the library to your dub configuration file, which will automatically download the D dependencies. The library also depends on cairo so you will need to have that installed. On ubuntu/debian you can install cairo with:
sudo apt-get install libcairo2-dev
GTK Support
The library also includes support for plotting to a GTK window. You can build this in using dub with:
dub -c ggplotd-gtk
If you want to add this to link to this version from your own D program the easiest way is with subConfigurations:
    "dependencies": {
        "ggplotd": ">=0.4.5"
	},
    "subConfigurations": {
		"ggplotd": "ggplotd-gtk"
	}
Documentation
This README contains a couple of examples and basic documentation on how to extend GGPlotD. API documentation is automatically generated and put online (including examples) under http://blackedder.github.io/ggplotd/ggplotd.html . For example for the available geom* functions see: http://blackedder.github.io/ggplotd/geom.html
Examples
At version v0.3.3 we have basic support for simple plots.
import ggplotd.ggplotd;
import ggplotd.aes;
import ggplotd.geom;
void main()
{
import std.array : array;
import std.math : sqrt;
import std.algorithm : map;
import std.range : repeat, iota;
import std.random : uniform;
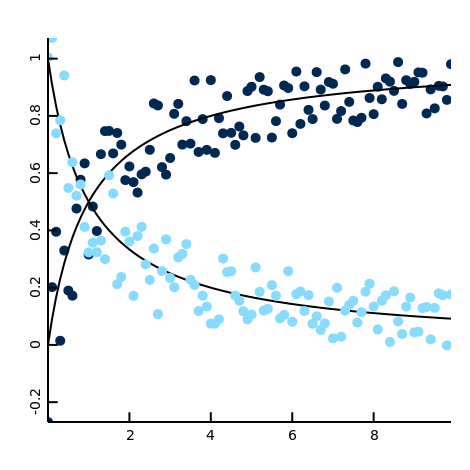
// Generate some noisy data with reducing width
auto f = (double x) { return x/(1+x); };
auto width = (double x) { return sqrt(0.1/(1+x)); };
auto xs = iota( 0, 10, 0.1 ).array;
auto ysfit = xs.map!((x) => f(x)).array;
auto ysnoise = xs.map!((x) => f(x) + uniform(-width(x),width(x))).array;
auto aes = Aes!(typeof(xs), "x",
typeof(ysnoise), "y", string[], "colour" )( xs, ysnoise,
("a").repeat(xs.length).array );
auto gg = GGPlotD().put( geomPoint( aes));
gg.put(geomLine( Aes!(typeof(xs), "x", typeof(ysfit), "y" )( xs, ysfit)));
//
auto ys2fit = xs.map!((x) => 1-f(x)).array;
auto ys2noise = xs.map!((x) => 1-f(x) + uniform(-width(x),width(x))).array;
gg.put( geomLine( Aes!(typeof(xs), "x", typeof(ys2fit), "y" )( xs,
ys2fit)));
gg.put( geomPoint( Aes!(typeof(xs), "x", typeof(ys2noise), "y", string[],
"colour" )( xs, ys2noise, ("b").repeat(xs.length).array) ));
gg.save( "noise.png" );
}
Histogram
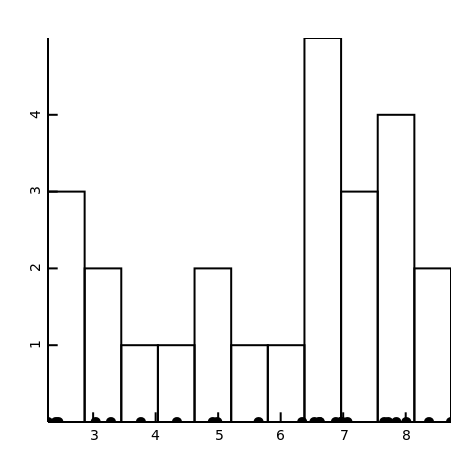
import ggplotd.ggplotd;
import ggplotd.aes;
import ggplotd.geom;

void main()
{
    import std.array : array;
    import std.algorithm : map;
    import std.range : repeat, iota;
    import std.random : uniform;
    auto xs = iota(0,25,1).map!((x) => uniform(0.0,5)+uniform(0.0,5)).array;
    auto aes = Aes!(typeof(xs), "x")( xs );

    auto gg = GGPlotD().put( geomHist( aes ) );

    auto ys = (0.0).repeat( xs.length ).array;
    auto aesPs = aes.merge( Aes!(double[], "y", double[], "colour" )
        ( ys, ys ) );

    gg.put( geomPoint( aesPs ) );

    gg.save( "hist.png" );
}
A 3D version of the histogram is also implemented in geomHist3D. See the example in the documentation for the code used to create this figure.

Combined histograms

import ggplotd.ggplotd;
import ggplotd.aes;
import ggplotd.geom;

void main()
{
    import std.array : array;
    import std.algorithm : map;
    import std.range : repeat, iota, chain;
    import std.random : uniform;
    auto xs = iota(0,50,1).map!((x) => uniform(0.0,5)+uniform(0.0,5)).array;
    auto cols = "a".repeat(25).chain("b".repeat(25));
    auto aes = Aes!(typeof(xs), "x", typeof(cols), "colour",
        double[], "fill" )(
            xs, cols, 0.45.repeat(xs.length).array);
    auto gg = GGPlotD().put( geomHist( aes ) );
    gg.save( "filled_hist.svg" );
}
Box plot

import ggplotd.ggplotd;
import ggplotd.aes;
import ggplotd.geom;

void main() {
    import std.array : array;
    import std.algorithm : map;
    import std.range : repeat, iota, chain;
    import std.random : uniform;
    auto xs = iota(0,50,1).map!((x) => uniform(0.0,5)+uniform(0.0,5)).array;
    auto cols = "a".repeat(25).chain("b".repeat(25)).array;
    auto aes = Aes!(typeof(xs), "x", typeof(cols), "colour",
        double[], "fill", typeof(cols), "label" )(
            xs, cols, 0.45.repeat(xs.length).array, cols);
    auto gg = GGPlotD().put( geomBox( aes ) );
    gg.save( "boxplot.svg" );
}
Custom axes, margins, image size and title

import ggplotd.ggplotd;
import ggplotd.geom;
import ggplotd.aes;
import ggplotd.axes;

void main()
{
    import std.array : array;
    import std.math : sqrt;
    import std.algorithm : map;
    import std.range : iota;
    // Generate some noisy data with reducing width
    auto f = (double x) { return x/(1+x); };
    auto width = (double x) { return sqrt(0.1/(1+x)); };
    auto xs = iota( 0, 10, 0.1 ).array;

    auto ysfit = xs.map!((x) => f(x)).array;

    auto gg = GGPlotD().put( geomLine( Aes!(typeof(xs), "x", typeof(ysfit),
        "y")( xs, ysfit ) ) );

    // Setting range and label for xaxis
    gg.put( xaxisRange( 0, 8 ) )
        .put( xaxisLabel( "My xlabel" ) );

    // Setting range and label for yaxis
    gg.put( yaxisRange( 0, 2.0 ) ).put( yaxisLabel( "My ylabel" ) );

    // change offset
    gg.put( xaxisOffset( 0.25 ) ).put( yaxisOffset( 0.5 ) );

    // Change margins
    gg.put( Margins( 60, 60, 40, 30 ) );

    // Set a title
    gg.put( title( "And now for something completely different" ) );

    // Saving as 500x300 pixel svg file
    gg.save( "axes.svg", 500, 300 );
}
Data
The examples above all use the Aes struct to hold all the data and pass it to geom* functions. Instead it is also straightforward to use your own data range as long as each element provides access to the needed data at compile time, i.e. for geomPoint the element needs to have a x and y field. See below for a simple example:
import ggplotd.ggplotd;
import ggplotd.aes;
import ggplotd.geom;

struct Point {
    double x;
    double y;
}

void main()
{
    /// http://blackedder.github.io/ggplotd/images/data.png
    import std.array : array;
    import std.math : sqrt;
    import std.algorithm : map;
    import std.range : iota;
    import std.random : uniform;
    // Generate some noisy data with reducing width
    auto f = (double x) { return x/(1+x); };
    auto width = (double x) { return sqrt(0.1/(1+x)); };
    auto xs = iota( 0, 10, 0.1 ).array;

    auto points = xs.map!((x) => Point(x,
        f(x) + uniform(-width(x),width(x))));

    auto gg = GGPlotD().put( geomPoint( points ) );

    gg.save( "data.png" );
}
Extending GGplotD
Due to GGplotD’s design it is relatively straightforward to extend GGplotD to support new types of plots. This is especially true if your function depends on the already implemented base types geomLine, geomPoint and geomPolygon. The main reason for not having added more functions yet is lack of time. If you decide to implement your own function then please open a pull request or at least copy your code into an issue. That way we can all benefit from your work :) Even if you think the code is not up to scratch it will be easier for the maintainer(s) to take your code and adapt it than to start from scrap.
geom*
In general a geom function reads the data, does some transformation on it and then returns a struct containing the transformed result. In GGPlotD the low level geom function such as geomLine, geomPoint and geomPolygon draw directly to a cairo.Context. Luckily most higher level geom* functions can just rely on calling geomLine, geomPoint and geomPolygon. For reference see below for the geomHist drawing implementation. Again if you decide to define your own function then please let us know and send us the code. That way we can add the function to the library and everyone can benefit.
/// Draw histograms based on the x coordinates of the data (aes)
auto geomHist(AES)(AES aes)
{
    import std.algorithm : map;
    import std.array : Appender, array;
    import std.range : repeat;
    import std.typecons : Tuple;

    // New appender to hold lines for drawing histogram
    auto appender = Appender!(Geom[])([]);

    foreach (grouped; group(aes)) // Split data by colour/id
    {
        auto bins = grouped.map!((t) => t.x) // Extract the x coordinates
            .array.bin(11); // Bin the data

        foreach (bin; bins)
        {
            // Specifying the boxes for the histogram. The merge is used to keep the colour etc. information
            // contained in the original aes passed to geomHist.
            appender.put(
                geomLine( [
                    grouped.front.merge(Tuple!(double, "x", double, "y" )(
                            bin.range[0], 0.0 )),
                    grouped.front.merge(Tuple!(double, "x", double, "y" )(
                            bin.range[0], bin.count )),
                    grouped.front.merge(Tuple!(double, "x", double, "y" )(
                            bin.range[1], bin.count )),
                    grouped.front.merge(Tuple!(double, "x", double, "y" )(
                            bin.range[1], 0.0 )),
                    grouped.front.merge(Tuple!(double, "x", double, "y" )(
                            bin.range[0], 0.0 )),
                ] )
            );
        }
    }

    // Return the different lines
    return appender.data;
}
Note that the above highlights the drawing part of the function. Converting the data into bins is done in a separate bin function, which can be found in the code.
stat*
ggplot2 for R defines a number of functions that plot statistics of the data. GGplotD does not come with any such functions out of the box, but the implementation should be very similar to the above named geom functions. The main difference will be that a stat function will have to do more data analysis. In that way the line between geom and stat functions is quite blurry; it could be argued that geomHist is a stat function. If you are interested in adding support for more advanced statistics then you should use the [geom example](#geom) as a starting point.
3D/heightmap/surface plots
Currently very few heightmap/surface geom* functions are implemented, but the building block: geomPolygon is provided. The geomPolygon function allows one to draw gradients dependent on height/colour. This function plots any straight/flat polygon, with the colour representing the height of the surface. Note that the function does not check whether the provided surface is flat. Because triangles are by definition straight it might be good to limit your usage to triangles, unless you are completely sure your polygon has no curves.
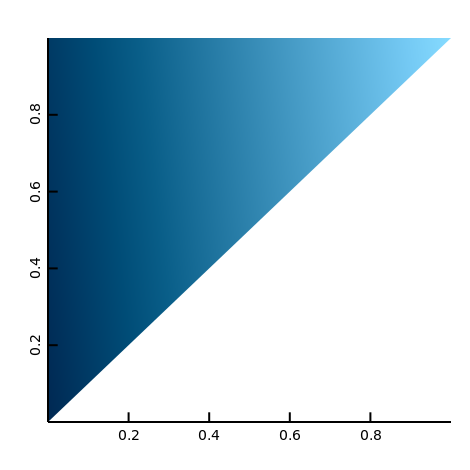
import ggplotd.ggplotd;
import ggplotd.geom;
import ggplotd.aes;

void main()
{
    auto gg = GGPlotD().put( geomPolygon(
        Aes!(
            double[], "x",
            double[], "y",
            double[], "colour" )(
            [1,0,0], [ 1, 1, 0 ], [1,0.1,0] ) ) );
    gg.save( "polygon.png" );
}
Usage as a library
If you want to use ggplotd to draw the plots, but keep the plot in memory, you can create an image surface and use drawToSurface to draw to it, without saving it to file.
auto width = 470;
auto height = 350;

auto gg = GGPlotD();

// Do what you want, i.e. add lines, add points etc.
// ...

// Create and draw to the surface. The cairo.Format you want probably
// depends on what you need to do with it afterwards.
auto surface = new cairo.ImageSurface(cairo.Format.CAIRO_FORMAT_ARGB32,
    width, height);
surface = gg.drawToSurface( surface, width, height );

// Use the resulting surface in your program
GTK window
If you build the library with GTK support you can show the plot in a window as follows:
void main()
{
    import core.thread;
    import std.array : array;
    import std.algorithm : map;
    import std.range : iota;
    import std.random : uniform;

    import ggplotd.ggplotd;
    import ggplotd.geom;
    import ggplotd.aes;
    import ggplotd.gtk;

    auto xs = iota(0,100,1).map!((x) => uniform(0.0,5)+uniform(0.0,5)).array;
    auto ys = iota(0,100,1).map!((y) => uniform(0.0,5)+uniform(0.0,5)).array;
    auto aes = Aes!(typeof(xs), "x", typeof(ys), "y")( xs, ys);

    // Start gtk window.
    auto gtkwin = new GTKWindow();

    // gtkwin.run runs the GTK mainloop, so normally blocks, but we can
    // run it in its own thread to get around this

    auto tid = new Thread(() { gtkwin.run("plotcli"); }).start();
    auto gg = GGPlotD().put( geomHist3D( aes ) );
    gtkwin.drawGG( gg, 470, 470 );
    Thread.sleep( dur!("seconds")( 2 ) ); // sleep for 2 seconds

    gg = GGPlotD().put( geomPoint( aes ) );
    gtkwin.clearWindow();
    gtkwin.drawGG( gg, 470, 470 );

    // Wait for gtk thread to finish (Window closed)
    tid.join();
}
References
Wilkinson, Leland. The Grammar of Graphics. Springer Science & Business Media, 2013.
- Registered by Edwin van Leeuwen
- 0.4.8 released 8 years ago
- BlackEdder/ggplotd
- BSL-1.0
- Copyright © 2015, Edwin van Leeuwen
- Authors:
- Dependencies:
- cairod, painlesstraits, dunit
- Versions:
-
Show all 57 versions1.2.3 2021-Apr-12 1.2.2 2020-Dec-02 1.2.1 2020-Feb-16 1.2.0 2019-Oct-03 1.1.9 2019-Jun-26 - Download Stats:
-
-
0 downloads today
-
1 downloads this week
-
2 downloads this month
-
102246 downloads total
-
- Score:
- 2.2
- Short URL:
- ggplotd.dub.pm